
In today’s interconnected digital landscape, ensuring the continuous availability of your cloud servers is paramount. Uptime and downtime are critical metrics that directly impact your business operations, customer satisfaction, and ultimately, your bottom line. Understanding how to effectively monitor uptime and downtime on your cloud servers is essential for proactive management and maintaining a reliable online presence. This article will delve into the intricacies of uptime and downtime monitoring, providing you with the knowledge and tools necessary to ensure optimal performance and minimize disruptions.
Monitoring server uptime and downtime allows you to identify potential issues before they escalate into major outages. By implementing robust monitoring strategies, you can gain valuable insights into the health and performance of your cloud servers. From choosing the right monitoring tools to interpreting the data and implementing corrective actions, this guide will equip you with the practical skills to effectively manage your cloud server uptime and mitigate the risks associated with downtime. We will explore various methods and best practices for monitoring your cloud server uptime and downtime, enabling you to maintain a highly available and dependable online service.
Why Uptime Monitoring Is Crucial
In today’s interconnected world, website and application availability is paramount. Uptime, the measure of a system’s operational duration, directly impacts business revenue, customer satisfaction, and brand reputation. Downtime, conversely, can lead to significant financial losses, erode user trust, and damage a company’s online presence. Uptime monitoring provides the essential vigilance needed to mitigate these risks.
Proactive monitoring allows for swift identification and resolution of issues before they escalate into major outages. This translates to minimized downtime and reduced impact on business operations. By constantly tracking system performance metrics, businesses can identify potential bottlenecks and optimize their infrastructure for enhanced stability.
Furthermore, uptime monitoring facilitates data-driven decision-making. Collected data provides insights into performance trends, helping businesses understand the root causes of downtime and implement preventative measures. This data can be invaluable for capacity planning, resource allocation, and overall system optimization.
Setting Monitoring Thresholds
Setting appropriate monitoring thresholds is crucial for effective uptime and downtime tracking. Thresholds define the conditions that trigger alerts, notifying you of potential issues. Availability thresholds specify the acceptable percentage of uptime. For instance, a threshold of 99.9% would trigger an alert if your server’s uptime falls below that level.
Response time thresholds dictate the maximum acceptable time for your server to respond to requests. Slow response times can indicate performance degradation or impending failure. Setting this threshold depends on your application’s specific requirements. A web server might have a lower threshold than a batch processing server.
Error rate thresholds define the acceptable percentage of failed requests. A sudden spike in error rates can point towards a critical problem. Define these thresholds based on your application’s expected error rate under normal operation. Choosing suitable thresholds depends on your specific needs and the criticality of your application. Regularly review and adjust them as needed.
Tools for Real-Time Monitoring
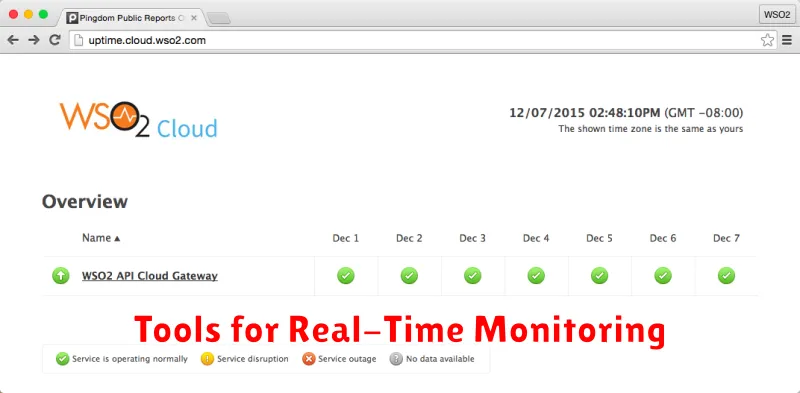
Real-time monitoring tools provide immediate feedback on server status, allowing for swift responses to downtime incidents. These tools typically use agents installed on the server or external checks to constantly monitor availability and performance metrics.
Pingdom, UptimeRobot, and StatusCake are popular choices for website and server uptime monitoring. They offer varying features, including detailed reporting, customizable alert thresholds, and multiple monitoring locations.
For more comprehensive server health monitoring, tools like Datadog, New Relic, and Dynatrace offer insights into various metrics, including CPU usage, memory consumption, and network traffic. These platforms often integrate with notification systems like Slack or PagerDuty for immediate alerts.
Choosing the right tool depends on your specific needs and budget. Consider factors such as the level of detail required, the types of alerts needed, and the complexity of your infrastructure when making your decision.
Email and SMS Alerts for Outages
Setting up real-time alerts is crucial for minimizing downtime impact. Email and SMS notifications are among the most common and effective methods for receiving immediate outage alerts. These alerts should be configured to trigger when specific downtime conditions are met.
For email alerts, ensure your monitoring system is configured with the correct email address(es) and that these addresses are actively monitored. Consider using a dedicated email address or distribution list specifically for outage notifications. This helps to prioritize and filter crucial alerts.
SMS alerts provide an even faster notification channel. While they may incur additional costs depending on your provider, the immediacy they offer can be invaluable, especially for mission-critical applications. Be mindful of potential message length limitations and ensure the essential information, like the affected server and timestamp, is included.
Most monitoring services offer customizable alert thresholds. You can define the conditions that trigger an alert, such as server unavailability, high latency, or resource exhaustion. Configure these thresholds carefully to avoid alert fatigue from false positives. Regularly review and adjust your alert settings as needed to maintain their effectiveness.
Analyzing Downtime Patterns
Analyzing downtime patterns is crucial for identifying the root causes of service disruptions and implementing effective preventative measures. Regularly reviewing downtime logs allows you to identify recurring issues and trends.
Look for patterns related to the time of day. Does downtime frequently occur during peak usage periods, suggesting potential capacity issues? Or does it happen late at night, potentially indicating scheduled maintenance problems?
Duration of downtime is another key factor. Short, frequent outages may point to transient network issues, while extended outages might suggest more serious infrastructure problems. Tracking the duration of downtime helps prioritize troubleshooting efforts.
Consider the frequency of downtime. Are outages isolated incidents, or do they occur regularly? Frequent outages, even if short, can significantly impact user experience and warrant immediate investigation.
Analyzing these patterns in conjunction with other metrics, such as error logs and resource usage, can provide valuable insights into the underlying causes of downtime and inform strategies for improved service reliability. Documenting your findings is crucial for future analysis and proactive problem solving.
Automated Recovery Techniques
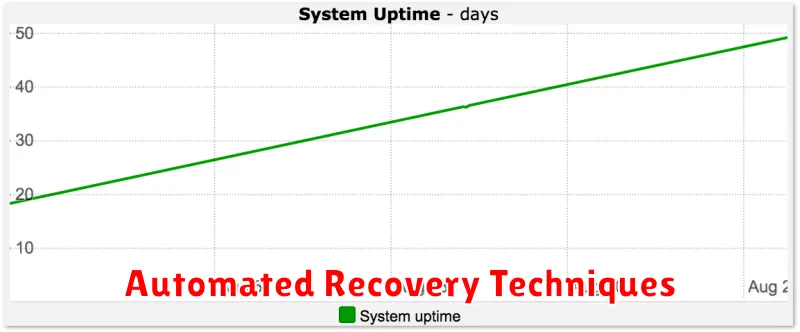
Automated recovery plays a crucial role in minimizing downtime and ensuring service availability. These techniques leverage pre-configured scripts and automated processes to address common failure scenarios without manual intervention.
System restarts are a primary automated recovery mechanism. When monitoring tools detect an unresponsive system, they can trigger a reboot automatically. This often resolves temporary glitches or resource exhaustion issues. More advanced systems can utilize failover mechanisms. In a clustered setup, if one server fails, another server automatically takes over its responsibilities, maintaining uninterrupted service.
Self-healing capabilities are another aspect of automated recovery. These systems can automatically diagnose and rectify specific problems. For example, a cloud server might automatically increase its allocated resources if its CPU utilization consistently exceeds a predefined threshold. Similarly, automated scripts can restart malfunctioning services or replace faulty components within a virtualized environment.
The choice and implementation of automated recovery techniques depend on the specific application and infrastructure. However, the core goal remains consistent: to swiftly identify and address issues, minimizing downtime and ensuring business continuity.
Best Practices for Continuous Uptime
Maintaining continuous uptime requires a proactive approach encompassing various best practices. Monitoring is crucial. Implement comprehensive monitoring tools that track key metrics like server response time, CPU usage, and network connectivity. Set up alerts to notify you immediately of any anomalies.
Redundancy is another key factor. Employ redundant systems and infrastructure components to eliminate single points of failure. This includes using redundant servers, power supplies, and network connections. Load balancing helps distribute traffic across multiple servers, ensuring availability even if one server fails.
Regular maintenance is essential for preventing downtime. Schedule routine maintenance windows for tasks like software updates, security patching, and hardware checks. Automate these tasks whenever possible to reduce human error and ensure consistency.
Disaster recovery planning is paramount. Develop a comprehensive disaster recovery plan that outlines procedures for restoring services in case of a major outage. This plan should include backups, failover mechanisms, and communication protocols. Regularly test your disaster recovery plan to ensure its effectiveness.
Finally, security plays a vital role in uptime. Implement robust security measures to protect your servers from cyberattacks. Regularly update security software and conduct vulnerability assessments to identify and address potential weaknesses.